Components
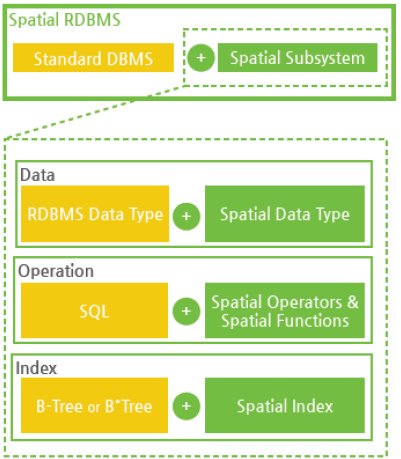
So a spatial DB is a collection of the following, specifically built to handle spatial data:
- types
- operators
- indices
Soon, we will explore what types, operators and indices mean.
Spatial DBs |
"A spatial database is a database that is optimized to store and query data related to objects in space, including points, lines and polygons."
In other words, it includes objects that have a SPATIAL location (and extent). A chief category of spatial data is geospatial data - derived from the geography of our earth.
Geographic data is NOT 'business as usual'!
In spatial data analysis, we distinguish between two conceptions of space:
For our purposes, we will adopt the 'entity' view, where space is populated by discrete objects (roads, buildings, rivers..).

So a spatial DB is a collection of the following, specifically built to handle spatial data:
Soon, we will explore what types, operators and indices mean.
CAD data:

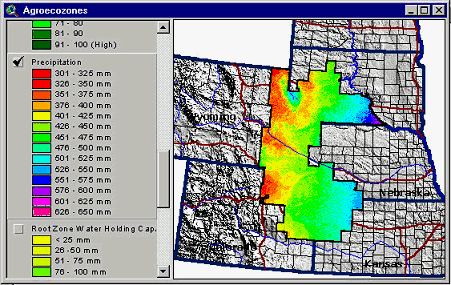
Agricultural data:
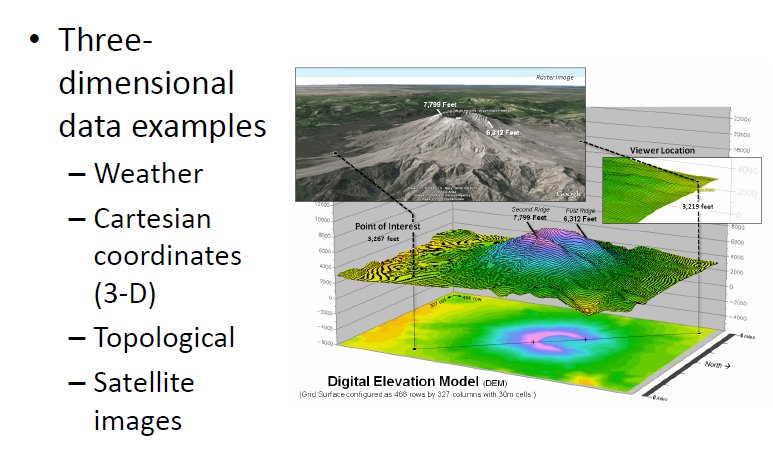
3D data:
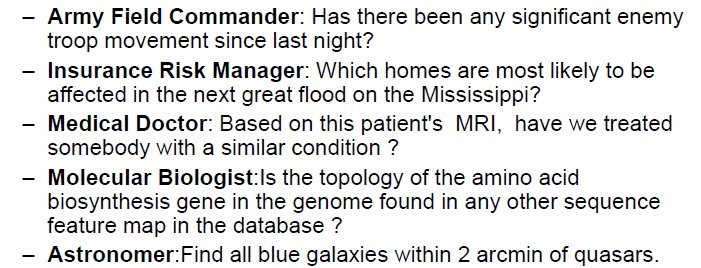
Various government agencies routinely coordinate spatial data collection and use, operating in effect, a national spatial data infrastructure (NSDI) - these include federal, state and local agencies. At the federal level, participating agencies include:
As you can see, spatial data is a SERIOUS resource, vital to national interests.
Spatial data is created in a variety of ways:
All spatial data can be described via the following entities/types:
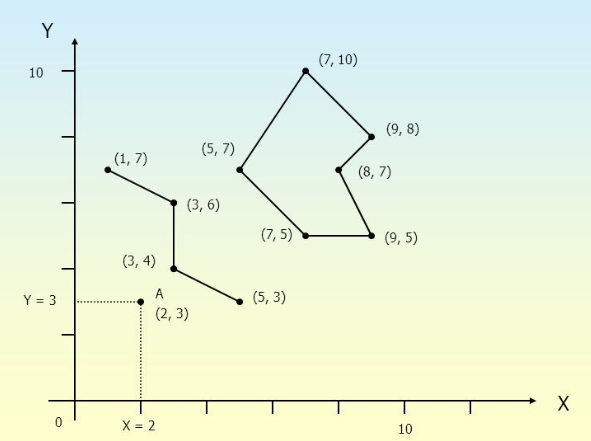
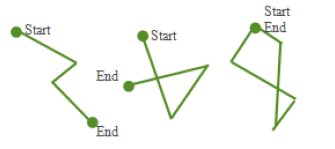

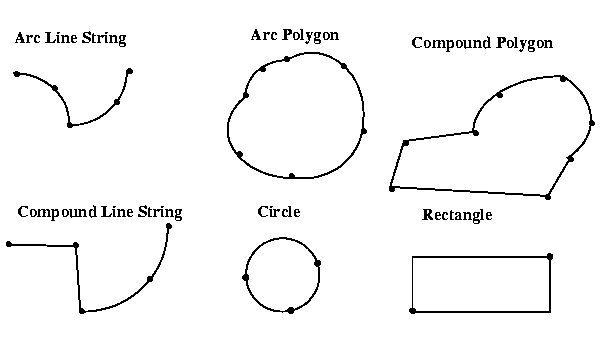
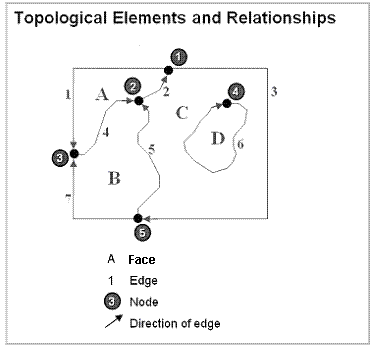
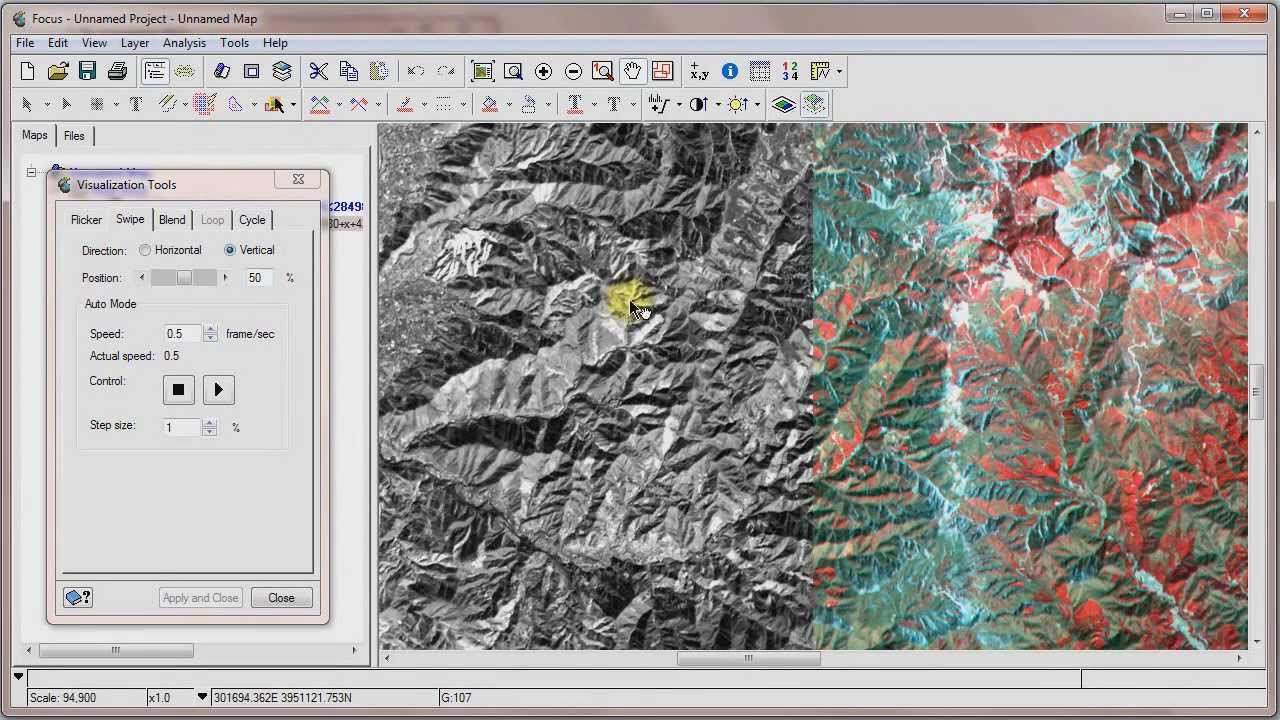
Once we have spatial data (points, lines, polygons), we can:
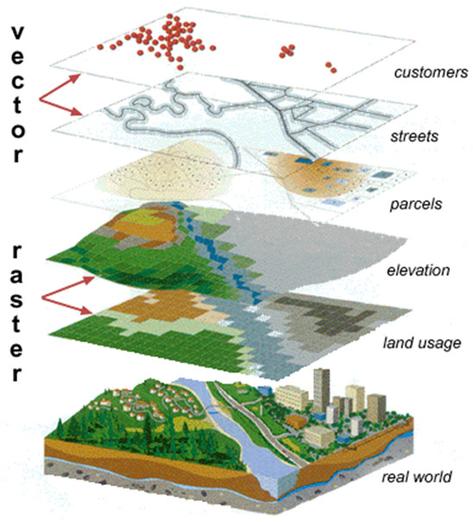
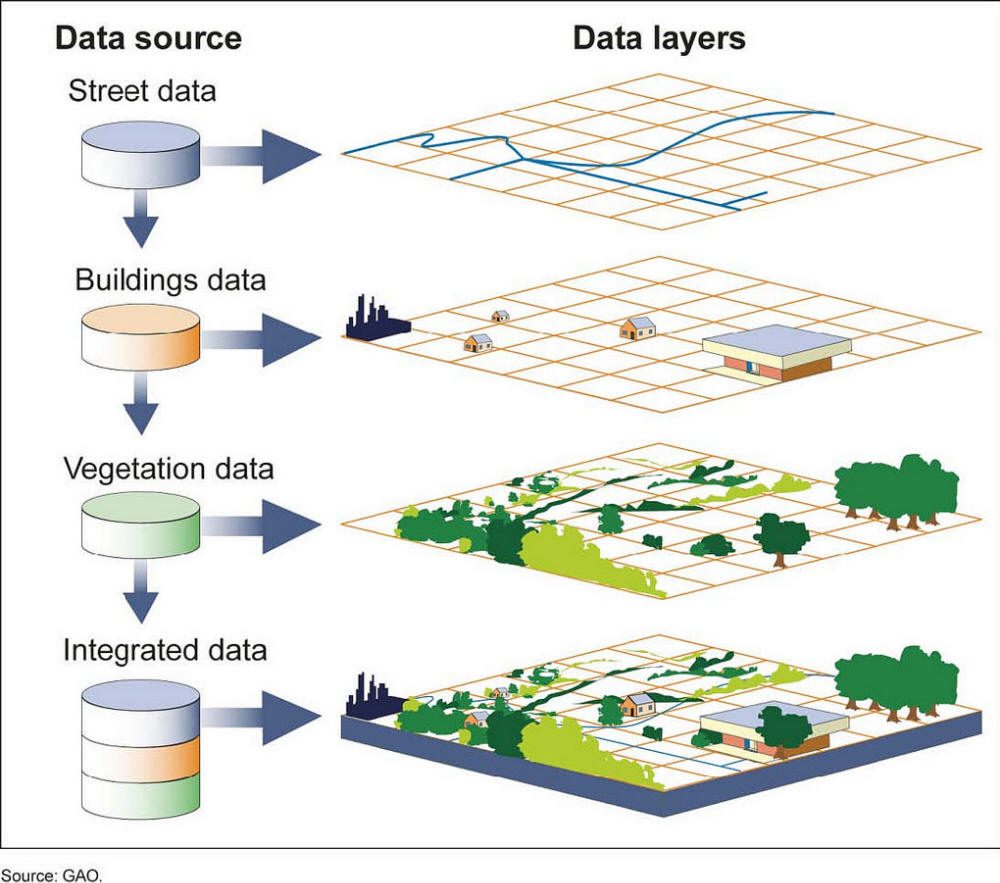
Look at this map, overlaid with scary data..
In 1D (and higher), spatial relationships can be expressed using 'intersects', 'crosses', 'within', 'touches' (these are T/F predicates).
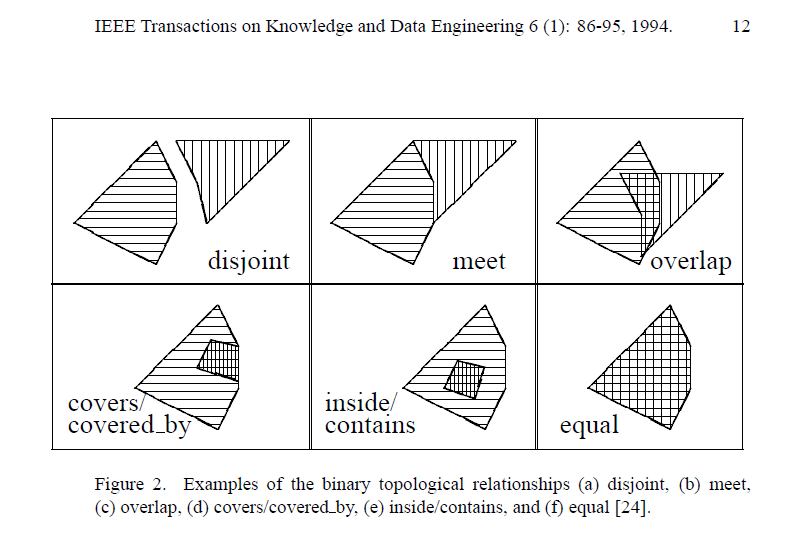
Here is a sampling of spatial relationships in 2D:
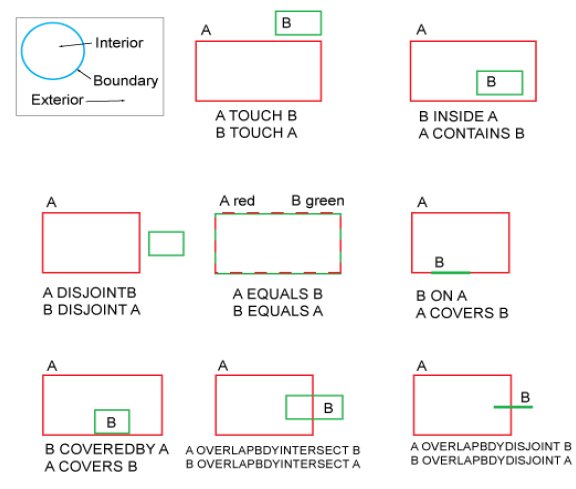
Another diagram showing the [binary] operations:
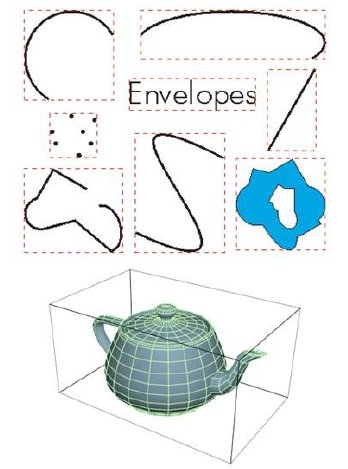
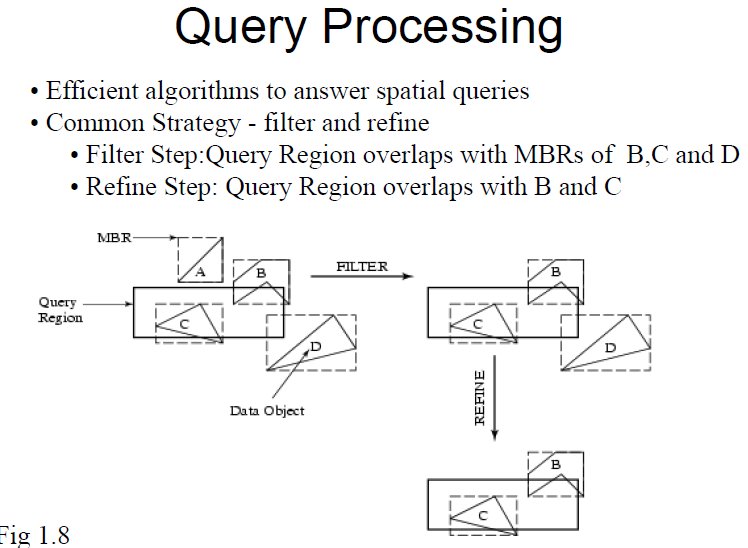
Minimum Bounding Rectangles (MBRs) are what are used to compute the results of operations shown above:
We can perform the following, on spatial data:
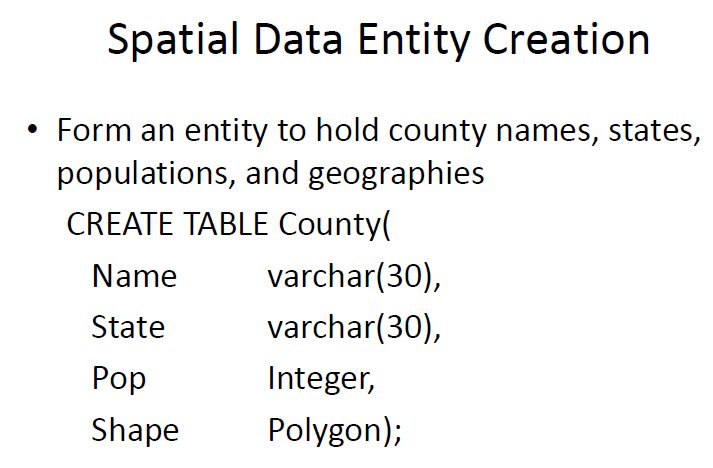
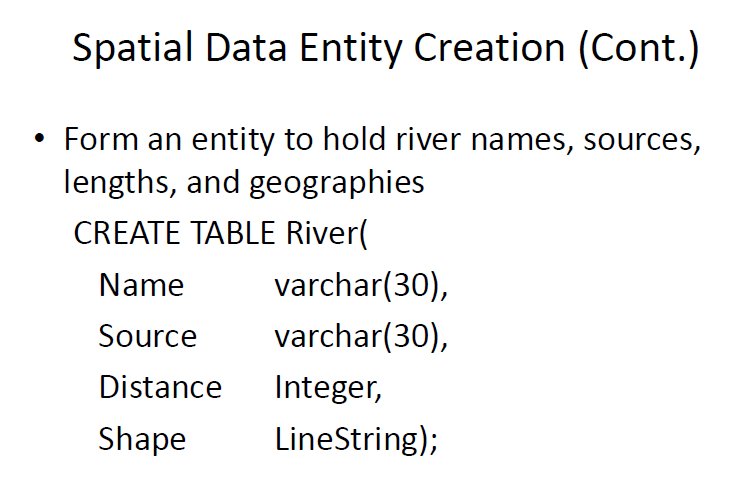
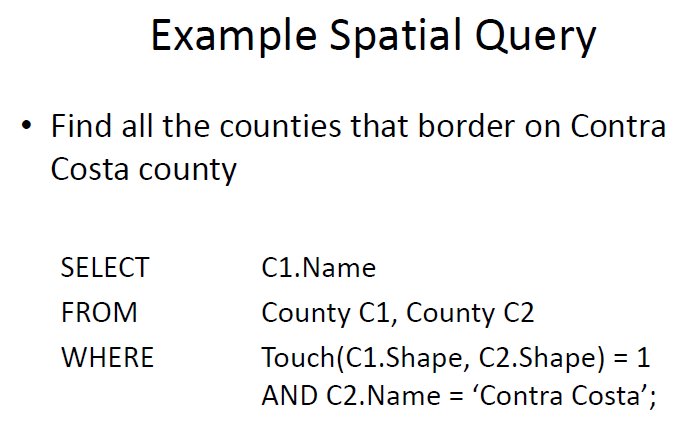
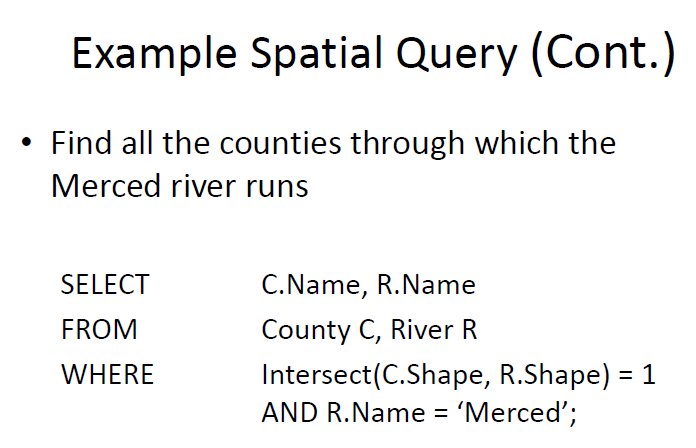
As (more so than) with non-spatial data, the creation and use of spatial indexes VASTLY speed up processing!
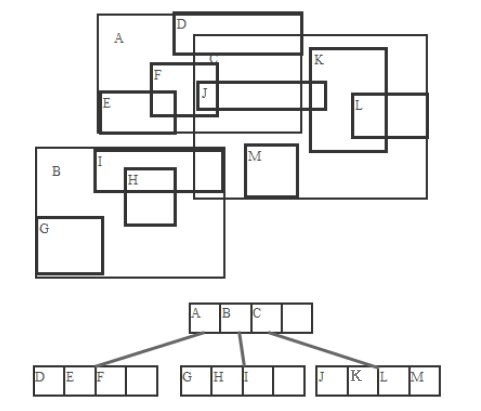
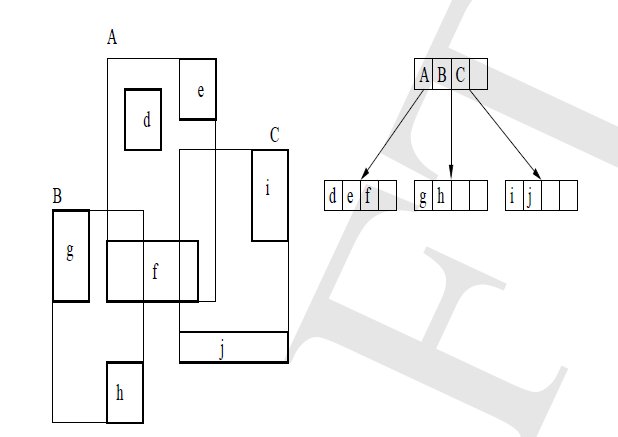
R trees use MBRs to create a hierarchy of bounds.
Variations, FYI: R+ tree, R* tree, Buddy trees, Packed R trees..
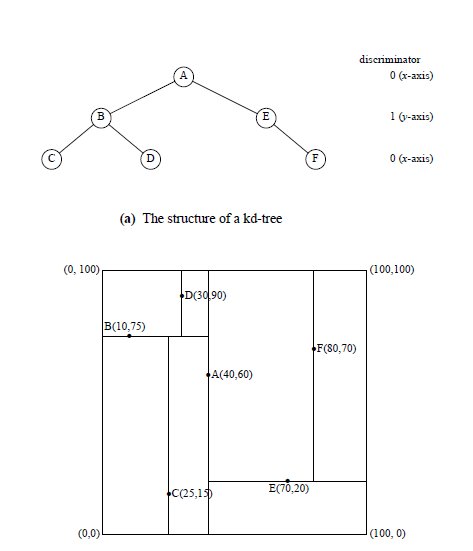
k-d tree
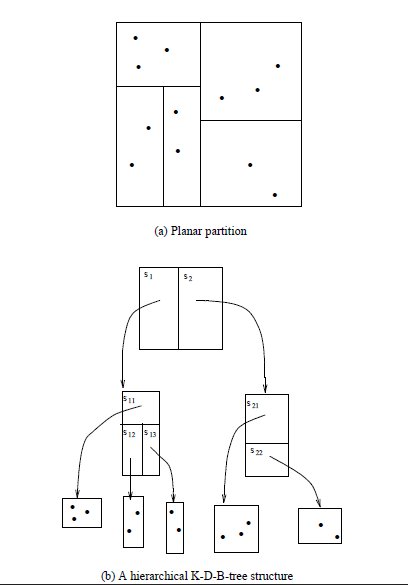
Alternate: K-D-B tree:
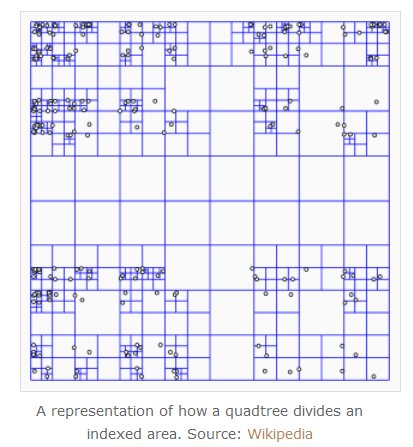
Each node is either a leaf node, with indexed points or null, or an internal (non-leaf) node that has exactly 4 children. The hierarchy of such nodes forms the quadtree.
A variety of non-spatial attrs can be mapped on to spatial data, providing an intuitive grasp of patterns, trends and abnormalities. Following are some examples.
Dot map:
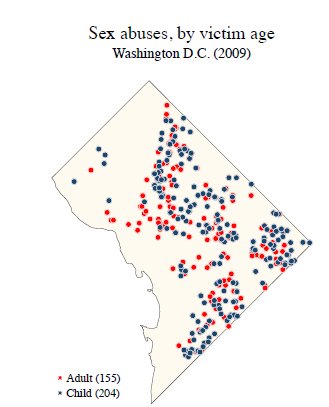
Here's another one.
Proportional symbol map:
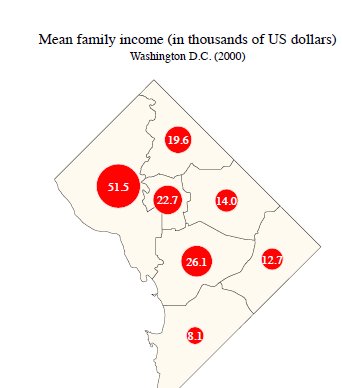
Diagram map:
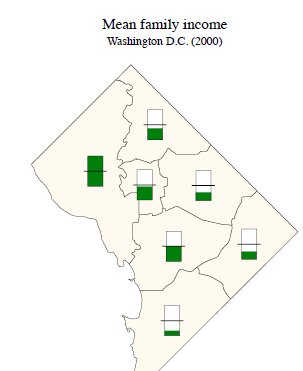
Another diagram map:
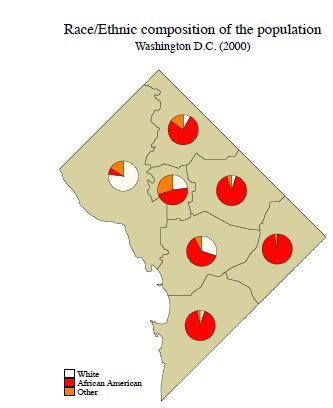
Also possible to plot multivariate data this way.
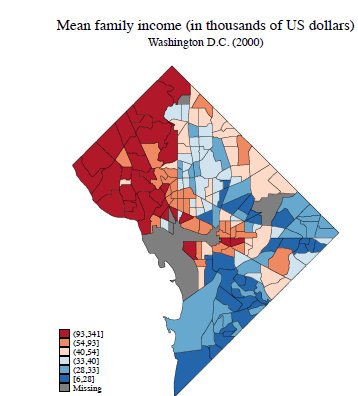
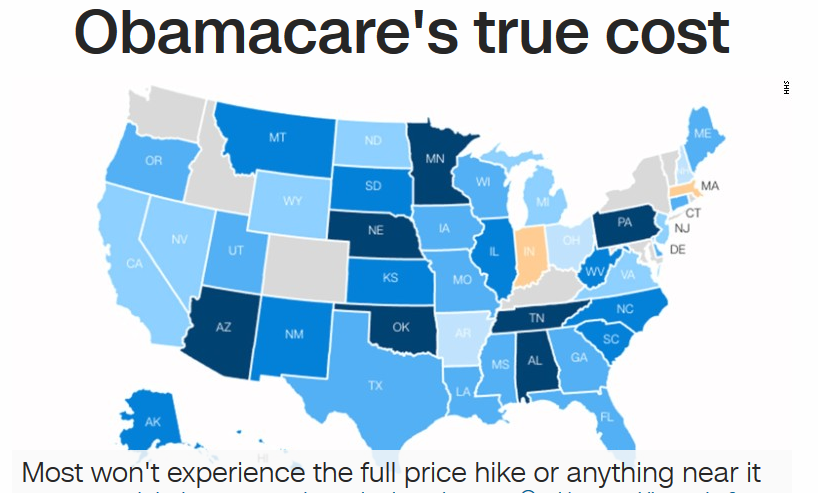
Choropleth maps (plotting of a variable of interest, to cover an entire region of a map):
Everyone!
Thanks to SQL's facility for custom datatype ('UDT') and function creation ('functional extension'), "spatial" has been implemented for every major DB out there:
Google's KML format is used to encode spatial data for Google Earth, etc. Here is a page on importing other geospatial dataset formats into Google Earth.
OpenLayers is an open GIS platform.
ESRI is the home of the powerful, flexible family of ArcGIS products - and they are local!
Here is a presentation from 2017, that highlights ArcGIS.
There is a variety of inexpensive/open source mapping platforms, competing with more pricey commercial offerings (from ESRI etc). Here are several:
• QGIS
• MapBox
• Carto
• Boundless
• GIS Cloud