Syntax, semantics
So what does R actually look like, what datatypes does it have, what operators? How are functions declared and called?
R particularly shines when it comes to operations on vectors (ordered LIST of elements), arrays, matrices and tables - all of which are built-in ('native') datatypes. Just like in Python (where list is the central data type), in R, it is all about vectors (R does have a list type as well). This is very similar to TensorFlow's use of a 'tensor' (which is a vector in R!).
R code can be executed interactively in a shell, or be run from a .R source file (script).
R is a functional programming language..
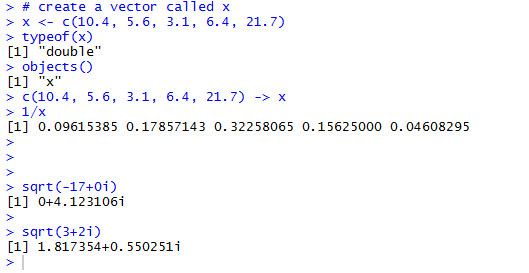
# create a vector called x
x <- c(10.4, 5.6, 3.1, 6.4, 21.7)

typeof(x) [and class(x) and mode(x)]

objects()

# alternative
assign("x", c(10.4, 5.6, 3.1, 6.4, 21.7))

c(10.4, 5.6, 3.1, 6.4, 21.7) -> x # !!!
1/x

y <- c(x,x) # y will have 10 entries

v <- 2*x + y + 1
# generates a new vector v of length 10 constructed by adding together,
# element by element, 2*x repeated 2 times, y repeated just once,
# and 1 repeated 10 times - in other words, this is a 'vector' op!
Here are sample operations (in RStudio):
Several functions operate on a vector, eg. range(), min(), max(), sum(), prod(), mean(), sort()..
Sequences are easy to create:
# c(1,2,3,4.....30)
> m <- 1:30
> m
 [1]  1  2  3  4  5  6  7  8  9 10 11 12 13 14 15 16 17 18 19
[20] 20 21 22 23 24 25 26 27 28 29 30

> n <- seq(2,5)
> n
[1] 2 3 4 5
>
Logical vectors (comprised of T,F) are created via conditions, eg.
> temp <- x>13
> temp
[1] FALSE FALSE FALSE FALSE  TRUE
>
Matrices/arrays are muti-dim versions of vectors [matrices can only be 2D, arrays can be any nD].
Lists can have elements of different types (vectors cannot).
Data frames are matrix-like structures, in which the columns can be of different types - this is how we can create/read in relations (table data!)! Eg. data.frame(x,y) will create a 2-column (x,y) table out of vectors x and y.
With a vector type, the following three things are possible, which makes it more powerful than a list:
- per-element operations are automatic, ie if x<-c(1,2,4), 1/x is (1,0.5,0.25)
- aggregate operations are possible, eg mean(x), and colMean(m) where m is a matrix
- vectors of different types (each vector is a column) can be aggregated into tables (ie. data frames)
Summary - R's (only) five non-atomic datatypes [first three are for identical (homogenous) elements, last two are for different (heterogenous) elements]:
- vector - a seq with identical types of elements
- matrix - a vector shaped as a rect (2D)
- array - a vector of >2D [because vector is for 1D, array is for 2D]
- list - a seq with different types of elements
- data frame [analogous to a (relational) table of data] - list of column vectors, columns can be of different types
This page mentions the differences between a vector, matrix, array, list and dataframe (mnemonic: "v-mald").
The following two diagrams [second is a screenshot from here] also illustrate the built-in datatypes (the first mentions 'factor' - this is simply a specific vector type, so it's not a new type).


Functions are objects as well (like with Python, JavaScript..). "The function tapply() is used to apply a function, here 'mean()', to each group of components of the first argument, here 'incomes', defined by the levels of the second component, here 'statef'" (sound a lot like Python's map()?):
> incmeans <- tapply(incomes, statef, mean)
Easy to write vector-oriented functions:
> stderr <- function(x) sqrt(var(x)/length(x))
Arrays can be created from vectors, via dim():
# if z has 1500 elements, here is how it can be turned
# into a 3D array:

> z = 1:1500
> dim(z) <- c(3,5,100)
> z
, , 1

     [,1] [,2] [,3] [,4] [,5]
[1,]    1    4    7   10   13
[2,]    2    5    8   11   14
[3,]    3    6    9   12   15

, , 2

     [,1] [,2] [,3] [,4] [,5]
[1,]   16   19   22   25   28
[2,]   17   20   23   26   29
[3,]   18   21   24   27   30

, , 3

     [,1] [,2] [,3] [,4] [,5]
[1,]   31   34   37   40   43
[2,]   32   35   38   41   44
[3,]   33   36   39   42   45

....
....
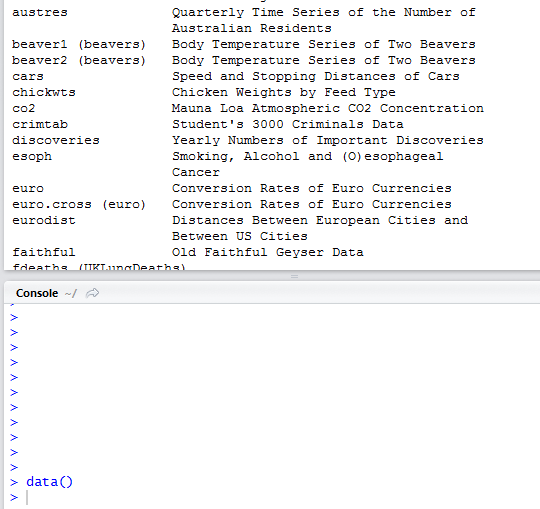
data() lists sample datasets:
edit() is used to edit data, spreadsheet-fashion:
xnew <- edit(xold)

xnew <- edit(data.frame())
R has a lot of probability distribution functions built-in:

A stem-and-leaf plot of data is easy to generate:
> attach(faithful) # READ in a dataset
> summary(eruptions)
Min. 1st Qu. Median Mean 3rd Qu. Max.
1.600 2.163 4.000 3.488 4.454 5.100
> fivenum(eruptions)
[1] 1.6000 2.1585 4.0000 4.4585 5.1000
> stem(eruptions)
The decimal point is 1 digit(s) to the left of the |
16 | 070355555588
18 | 000022233333335577777777888822335777888
20 | 00002223378800035778
22 | 0002335578023578
24 | 00228
26 | 23
28 | 080
30 | 7
32 | 2337
34 | 250077
36 | 0000823577
38 | 2333335582225577
40 | 0000003357788888002233555577778
42 | 03335555778800233333555577778
44 | 02222335557780000000023333357778888
46 | 0000233357700000023578
48 | 00000022335800333
50 | 0370
There is more to learn! If you are interested, go through the books/sites listed at the end of this lecture. Meanwhile, here is a '.R' script filled with practice commands; this is another (neither of these are mine).
Here is a nice reference card that summarizes all the aspects of R.
